Have Glasgow roads become busier since 2000?
A look into daily traffic levels in Glasgow City Council from 2000-2018
The annual traffic mileage travelled in Glasgow City Council has increased by 342,635,237.02 miles from 2000 - 2018.
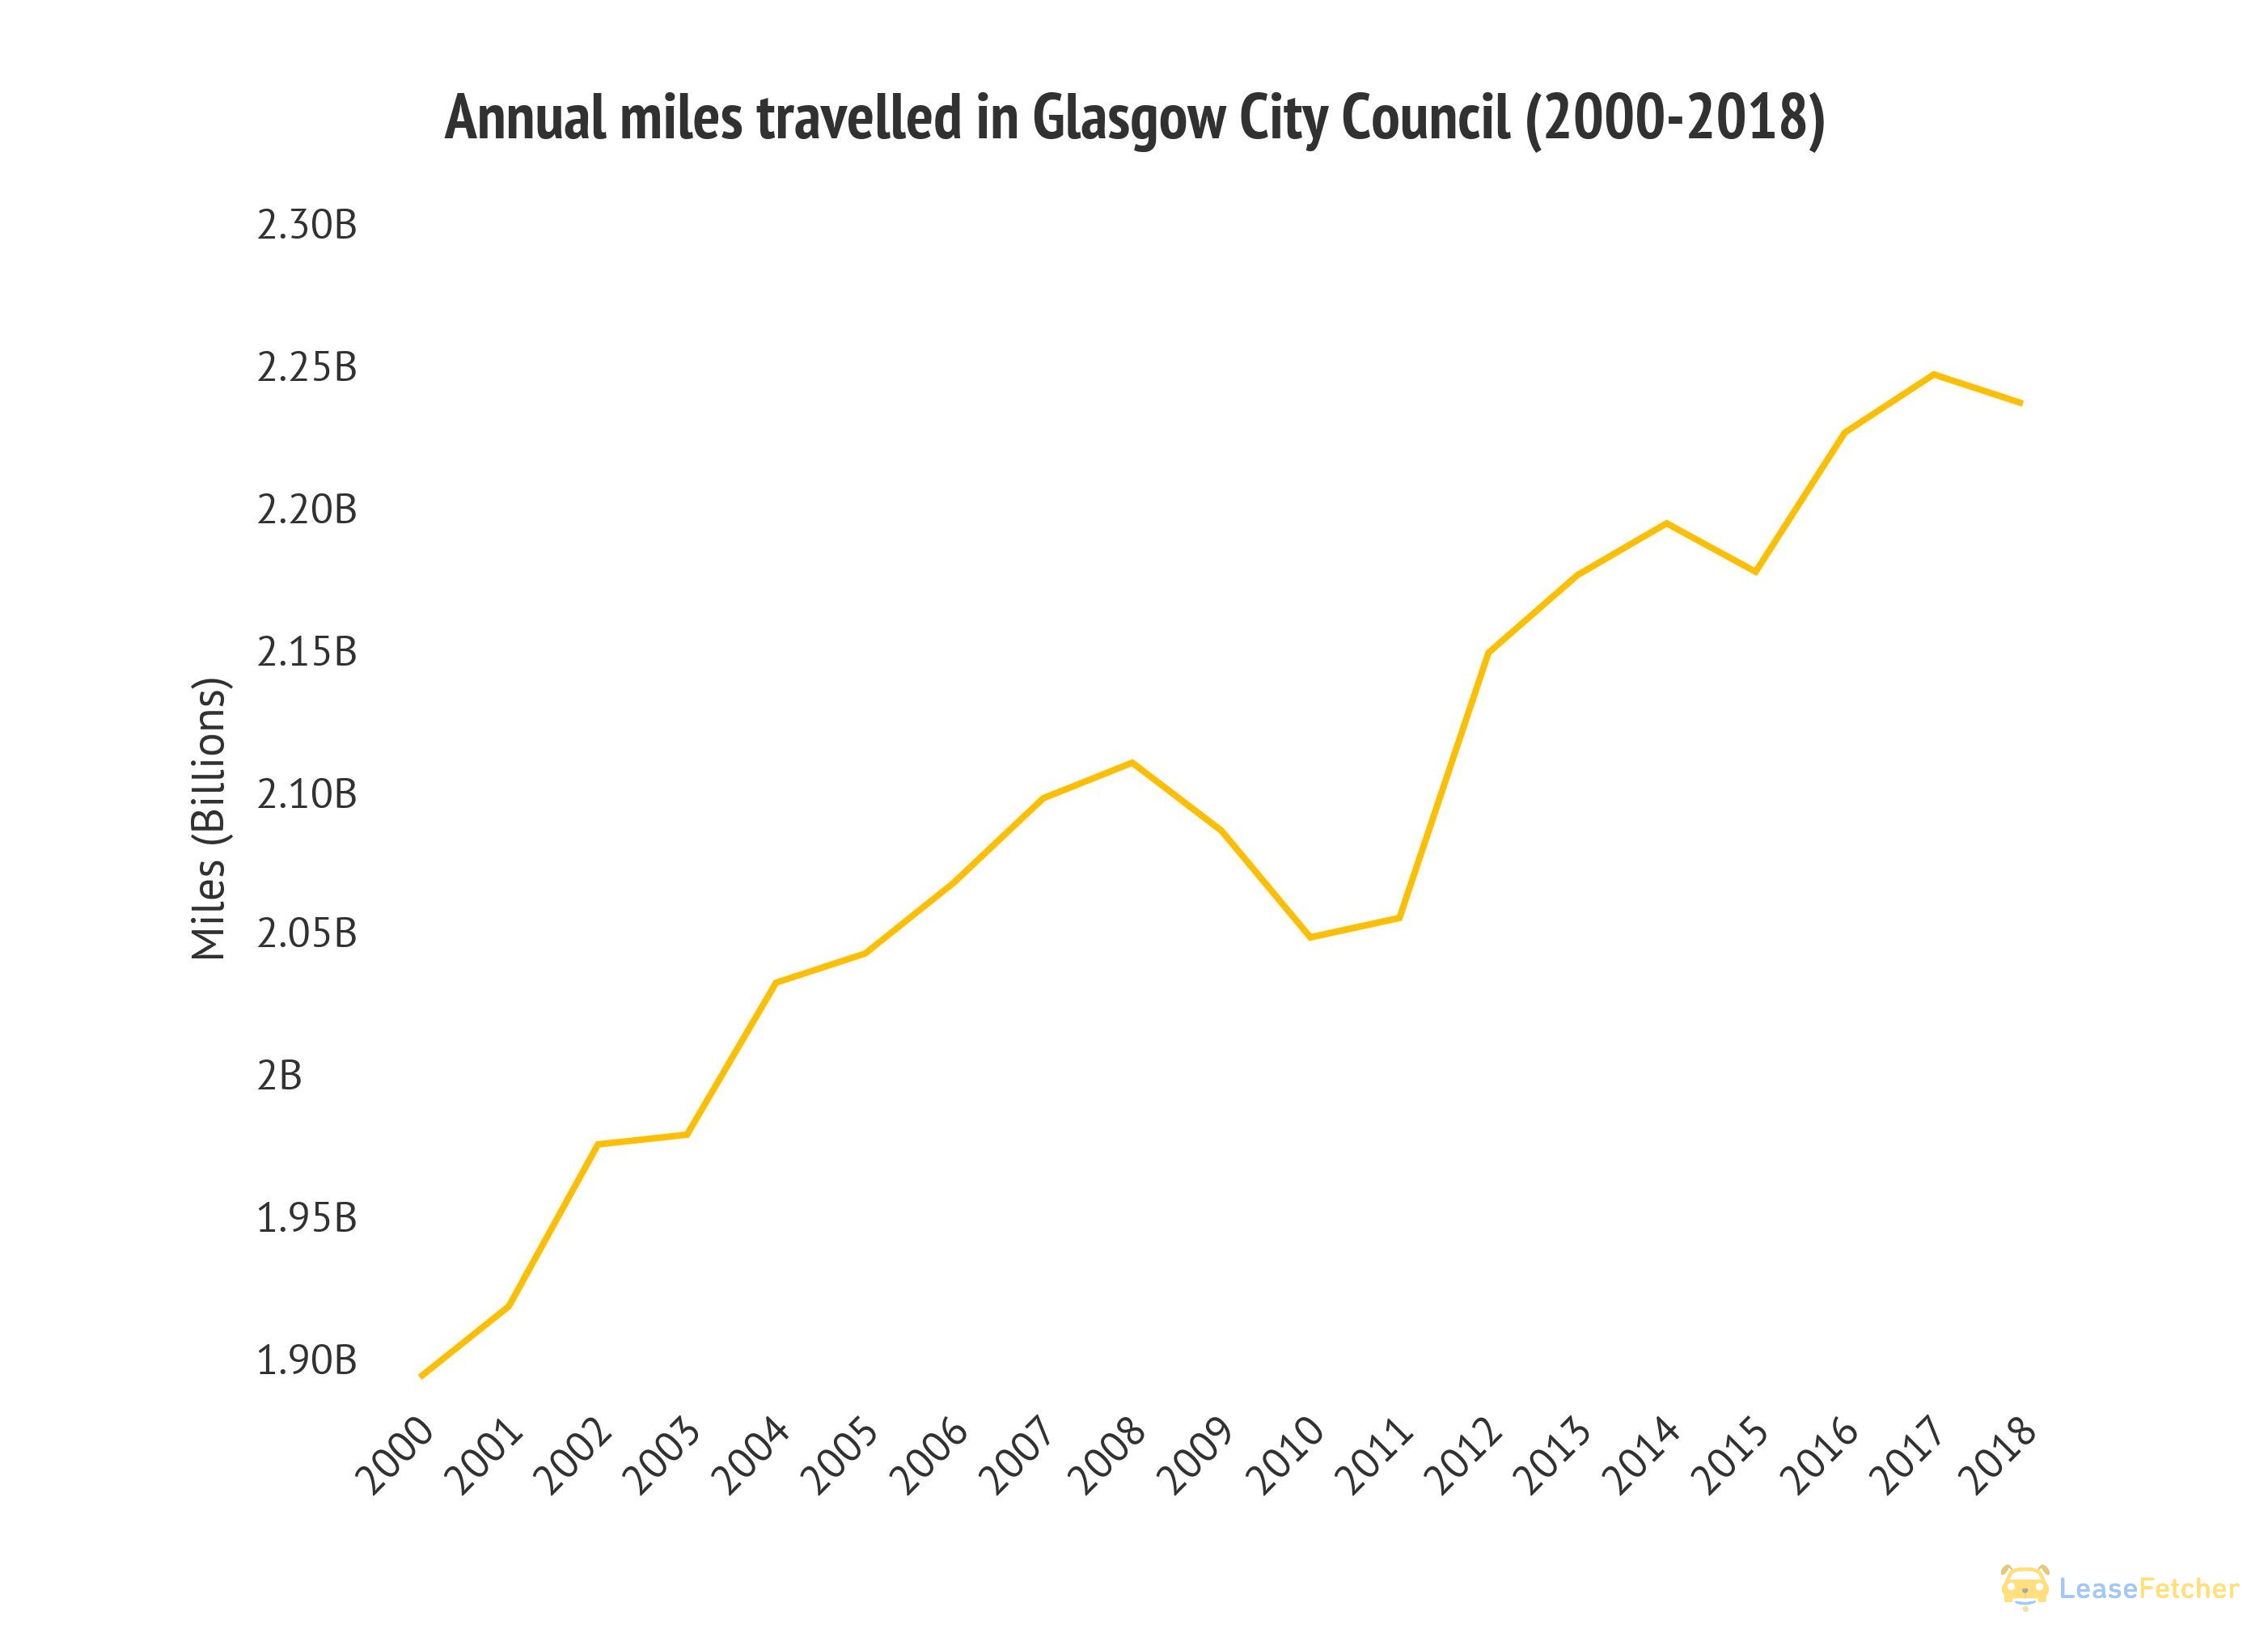
That’s the equivalent of travelling 13,759.90 times around the world. But has your route most travelled gotten any busier over the past 18 years? As brave commuting Glaswegians ourselves, we’ve investigated!
With data from the Department for Transport (DfT), the number crunchers at Lease Fetcher - one stop shop for personal car lease and business car lease comparison - looked into the top busiest road stretches and traffic inflows into Glasgow City Centre on an average neutral day and how the counts of vehicles have changed over the years.

Travelling from… the West Coast
The M8 stretches all the way from Greenock Inverclyde via Glasgow and all the way to Edinburgh. If you’re coming in via the scenic route, the stretch of motorway running parallel with the Clyde, or even from Sunny Largs, you’ll pass the M8 Eastbound Junctions: 25-23.
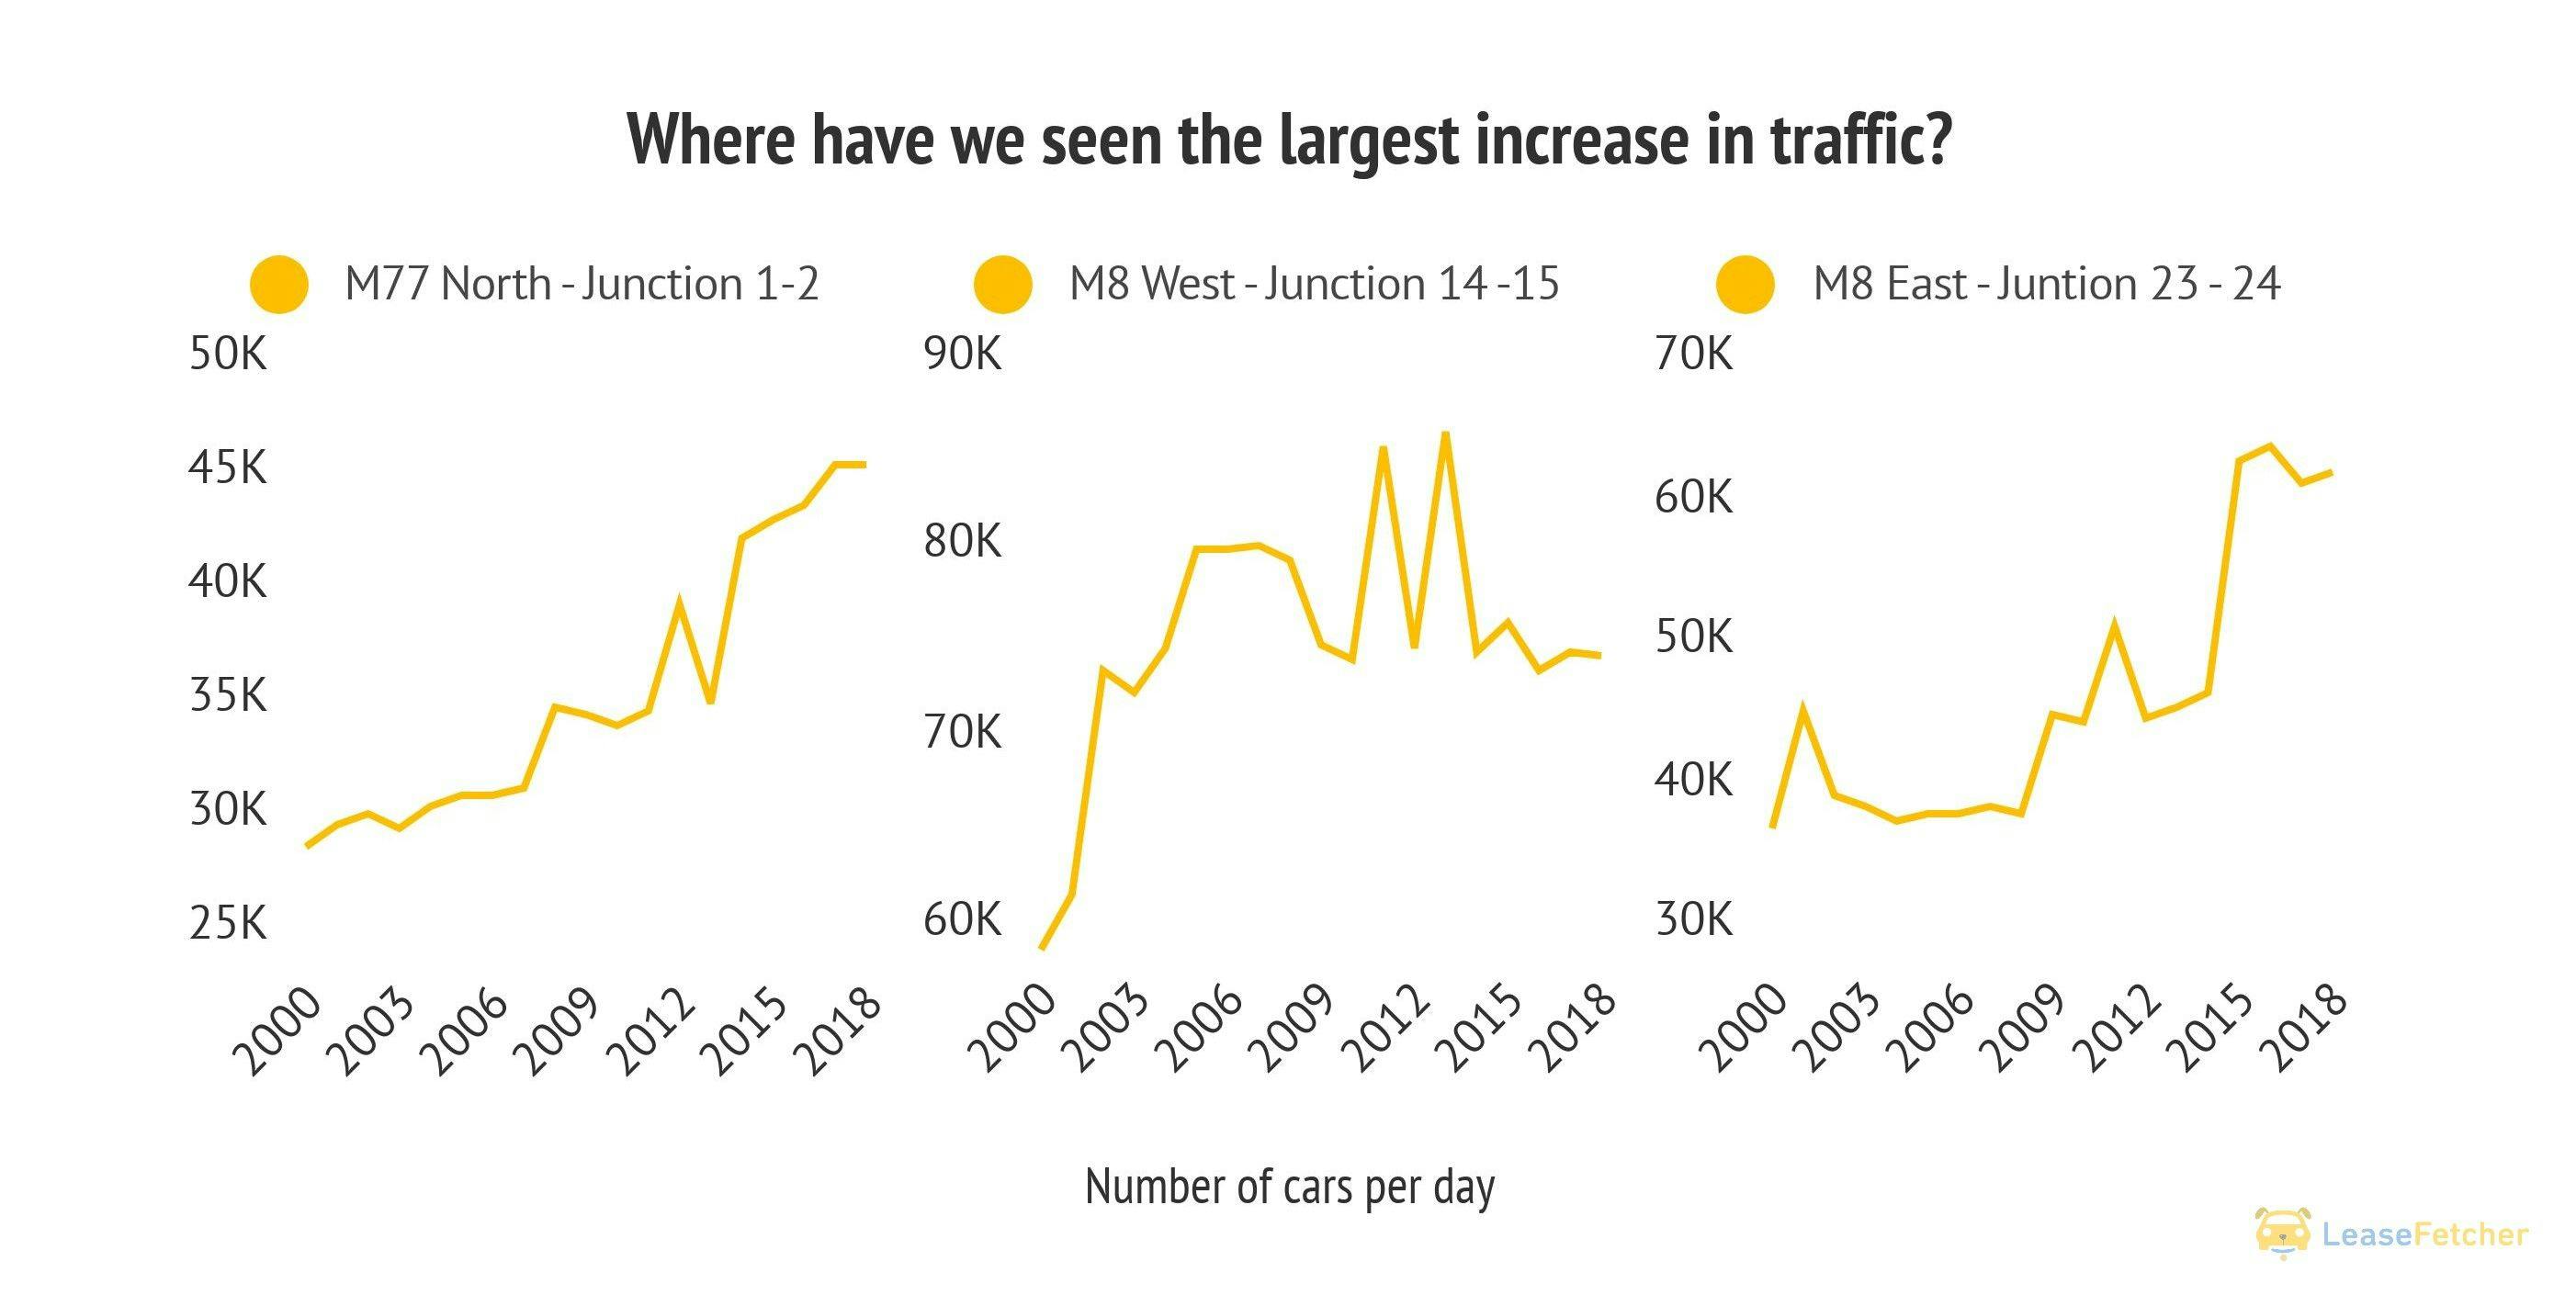
Data from the DfT show that on the stretch M8 East, Junction 24-23 - there were 25,047 (64.74%) more vehicles passing the counting point/ day in 2018 vs. 2000, with an average increase of 3.39% vehicles per year.
For the M8 East, Junction 25-24, the daily vehicle count in 2018 was 25,725 (70.84%) more than in 2000. The junction 25-24 saw a yearly average increase of 3.24% vehicles.
The M8 Eastbound after Braehead, past the Queen Elizabeth Hospital and into town has most definitely gotten busier over the previous 18 years.
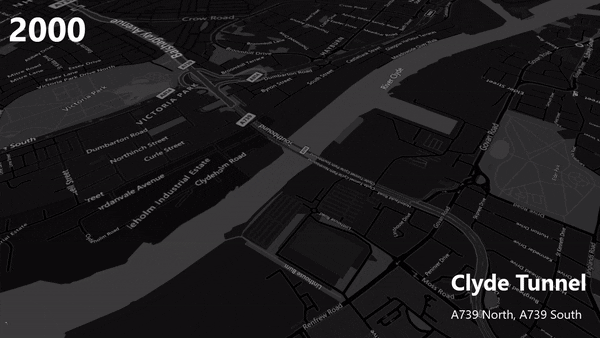
Travelling via… the Clyde Tunnel
The Clyde tunnel is an important stretch of road linking Govan and the West End of Glasgow. Providing a snappy shortcut under the Clyde, the tunnel can spare you the Kingston Bridge Gridlock and the mileage to get all the way to the Erskine Bridge.
Including the smallest ferry crossing in town, the Yoker ferry, crossings west of the Clyde Tunnel give little relief to its traffic levels. However, with an opening bridge stretching from Renfrew Riverside across to Clydebank expected to open in 2022 - there’ll likely be even less strain on the good ol’ tunnel.
Comparing the vehicles travelling on the A739 via the tunnel, the numbers have decreased over the years. In 2000, there were 28,871 vehicles counted on the day travelling in the northbound direction. In 2018, there were only 25,111. A decrease of 3,760 vehicles or 13.02%.
In the southbound direction, there were also fewer vehicles counted, with 29,430 in 2000 compared to 21,718 in 2018, a decrease of 7,712 vehicles or -26.2%.
Fun fact: In the Clyde Tunnel, there are 3,656 more cars/ per day (avg.) going in the Northbound direction than south. We wonder, where are they going and why aren't they coming back?
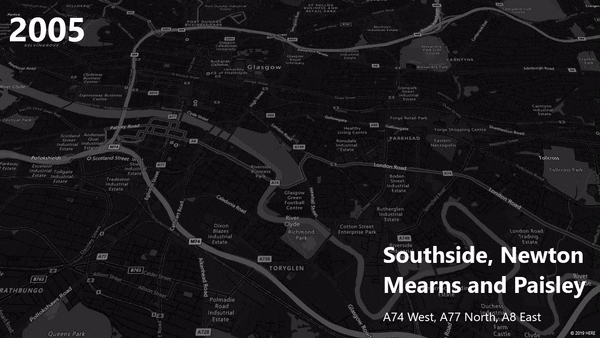
Travelling from… the Southside, Newton Mearns, Paisley and via Glasgow Green
Often heading into Glasgow via the A77 Pollokshaws Road, via the A8 East coming from Paisley or zooming past Glasgow Green on the A74?
Good news for you.
The three routes have stayed more or less the same over the previous years, two of them (A77 & A74) even with a small decline in vehicle numbers.
All three A roads have a mightier motorway sibling that’s similarly routed. Perhaps the M8, M77 and the M74 are just quicker and easier to travel via?
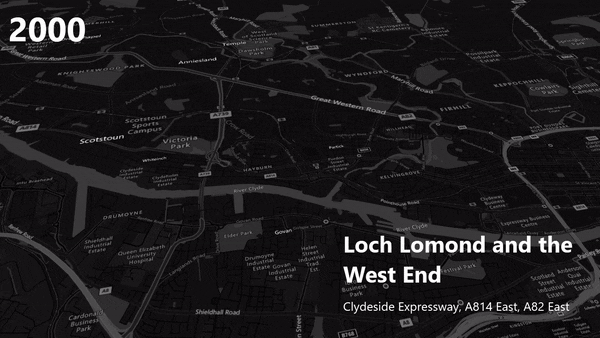
Travelling from… Loch Lomond & Glasgow’s West End
If you’re lucky enough to live by the shores of Loch Lomond, in the Glam West End or on the north banks of the River Clyde then you’re likely shooting into Glasgow via the A82 East (Great Western Rd), or touching base with the Clydeside Expressway.
Ignoring the extreme outliers for the Expressway, as it is slam-bang next to one of the largest music venues in town, the traffic has only increased marginally from the first measurement in 2005 and until 2018. With a total increase of 598 vehicles on the day of counting (2007 vs 2018), there has been an average increase of just 1.32% year on year.
The previous stretch to the Clydeside Expressway, Eastbound A814, has a very similar trend line - with a total of 1,160 more vehicles counted in 2018 vs 2000, and an average yearly increase of 1.23% from 2000 - 2018.
At the Anniesland Cross at Great Western Road (A82 East), the number of vehicles counted in 2018 decreased compared to 2000. In 2018 there were a total of 11,797 vehicles counted, an overall decrease of 870 vehicles compared to 2000, or -6.87%. Not a big change, but a slight change none the less.
Maybe commuters have finally realised that the First 1 buses that take you all the way from Helensburgh & Balloch, skip the outskirts of town, and takes straight to the city centre via the Cydeside Expressway.
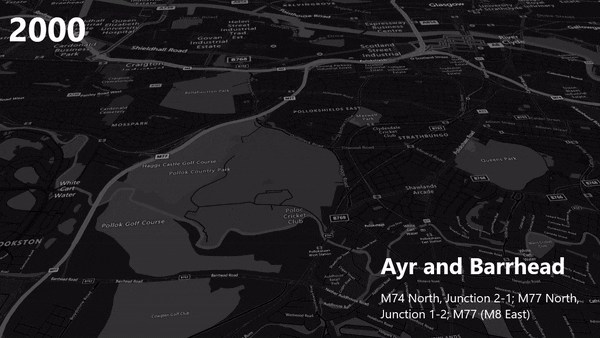
Travelling from… Ayr & Barrhead
Many people prefer a slightly longer commute over the hustle and bustle of living in the city centre. If you’re a seaside kinda gal or chap, living it up on Ayr beach after a long day at work, then you’re likely taking the M77 North whenever you need to get into town. Unless of course, you’re a fan of the windy B roads or prefer the rail.
Unfortunately, the M77 North has gotten quite considerably busier from 2000 to 2018. In 2000, there were 29,718 vehicles counted between Junction 2-1, the stretch between Silverburn and the Bellahouston junction, in 2018 there were 46,492, a total increase of 56.44% (compared to 2000) and an average increase of 2.71% year on year.
The stretch after the Bellahouston junction has experienced a similar increase in traffic with an average vehicle count increase of 9.35% year on year.
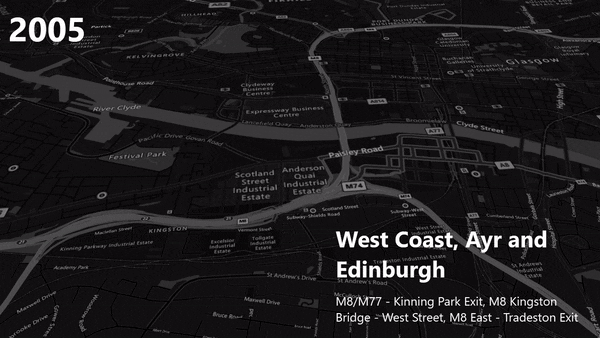
Travelling from… the West Coast, Ayr & Edinburgh
Whether you’re coming from the South, West, North or the East - you’ll need off the motorway to get into the city centre.
Two of the busiest slip roads are the Kinning Park & Tradeston exits that run off the M77/M8 before the left lanes turn into M74. Coming from the West & South, these are two of the easier ways to get into the centre of Glasgow is via King George V Bridge or if you’re going to the southside.
Traffic taking the Kinning Park exit onto Seaward Street has steadily increased over the past 18 years. From the first vehicle count in 2012 (88,323) to 2018 where there were 110,283 vehicles counted, there’s been an average increase in daily traffic of 3,660 looking back year on year.
The Tradeston exit right after the exit at Kinning Park Junction toward the Quay has seen a decrease in traffic since first counted in 2013. With an average decrease of 5.96% vehicles year on year, there were a total of 40,099 (-41%) fewer vehicles on the date of counting in 2018 compared to 2013.
M8 West sliproad from Kingston Bridge onto West Street has had a slow but steadily increasing number of travelling vehicles since the first count in 2005 with a total overall increase of 8,626 (11%) vehicles (2006 vs 2018).
It seems that the limited city centre parking isn’t quite putting a stopper for travelling into the city.
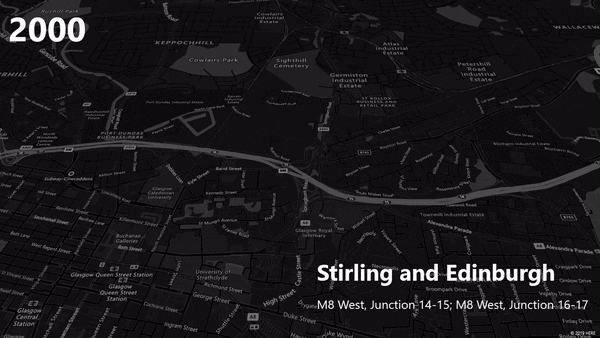
Travelling from… Cumbernauld, Stirling & Edinburgh
The new M8 is finally finished. If you’re a regular on the Westbound stretch into Glasgow, you must be thrilled! Nice wide roads, a bunch of lanes, and smooth new asphalt. The new stretch of M8 must be the stuff of dreams for a commuter… When you’re not in the 5 pm gridlock.
Looking over the stats from DfT, the M8 West has only gotten busier.
Junction 14-15 has seen an average increase of 1.62% year on year, and comparing to 2000 - there were a total of 15,595 (25.96%) more vehicles on the road on the day of counting in 2018.
With the majority of traffic continuing on the M8 West, the road from Junction 16-17 also saw an increase in vehicles counted with 9,453 (16.78%) more in 2018 than counted in 2000.
Overall…
Considering all the routes that we’ve looked at, there has been an average increase of vehicles on the road of 0.65% per year. M77 (M8 East) After Pollok Park was, on average, the stretch of road with the highest increase in traffic per year with a mindblowing 9.35% (or 2,784 vehicles).
The stretch of road with the largest average yearly reduction in vehicles was the A74 West - Fullarton Road to Dunn Street with an average yearly 7.48% decrease in vehicles (or 396 vehicles)
The roads that have seen the largest traffic increases from 2000-2018 were the M77 Northbound, stretch between junction 1 -2, the M8 Westbound junction 14-15 and lastly the M8 Eastbound junction 25-24.
With most of the routes we investigated getting busier, we think it's safe to say that the roads of Glasgow, in general, are getting busier with every year that passes.
Methodology notes
There are a lot of roads in Glasgow, and it would simply be impossible to count the traffic on every stretch of road for every single day of the year. As a compromise, the DfT has counted the traffic on one so-called ‘neutral’ day per year. This is a day out with the school holidays and not on a bank holiday.
DfT’s road link level traffic estimates are calculated using a range of methods, with some likely to produce more accurate estimates than others. Figures having an estimation method of “Counted” are likely to be more accurate than those marked as “Estimated”, and the latter should be used with caution. You can access the original data here: Raw counts
As a result of this, our report focuses on the general trend lines and total increase over the period of the vehicle counts rather than the exact increase year on year as this can be slightly skewed data.