The World's Most Electric Car-Friendly Countries
Electric cars will soon dominate our roads - but which countries are already making the biggest strides towards full electrification? This EV Index takes a deep dive into the progress some of the most EV-friendly countries are making in terms of adoption and charging network implementation.
Spread of EV Adoption
To get an idea of how countries stack up against each other in the race to electrification, it’s not enough to look solely at the number of EVs on the road. The table provides a broader overview of adoption progress for the most EV-friendly countries.
| BEV+PHEV Stock 2019 | Ratio of BEV+PHEV :Population | BEV Market Share (2019) | PHEV Market Share (2019) | No. Slow Chargers | No. Fast Chargers | Ratio of BEV+PHEV : Chargers | |
|---|---|---|---|---|---|---|---|
| China | 33,673,000 | 24:1000. | 3.9 | 1.1 | 301,238 | 214,670 | 20:1000. |
| Japan | 2,903,000 | 23:1000. | 0.5 | 0.4 | 22,536 | 7,858 | 10:1000. |
| South Korea | 924,000 | 18:1000. | 1.9 | 0.2 | 6,514 | 2,673 | 10:1000. |
| USA | 14,462,000 | 44:1000. | 1.5 | 0.5 | 64,265 | 13,093 | 10:1000. |
| Canada | 1,411,000 | 38:1000. | 1.9 | 1.06 | 7,976 | 975 | 10:1000. |
| UK | 2,624,000 | 39:1000. | 1.8 | 1.7 | 22,359 | 4,735 | 10:1000. |
| Norway | 3,286,000 | 614:1000. | 45.9 | 14.6 | 5,466 | 3,970 | 3:10000. |
| Netherlands | 2,158,000 | 125:1000. | 15.2 | 1.3 | 49,324 | 829 | 20:1000. |
| France | 2,294,000 | 34:1000. | 2.1 | 0.9 | 27,661 | 2,040 | 10:1000. |
| Sweden | 1,194,000 | 116:1000. | 5.1 | 7.9 | 8,279 | 1,161 | 10:1000. |
| Germany | 3,032,000 | 36:1000. | 1.8 | 1.3 | 34,203 | 2,860 | 10:1000. |
EV Stock
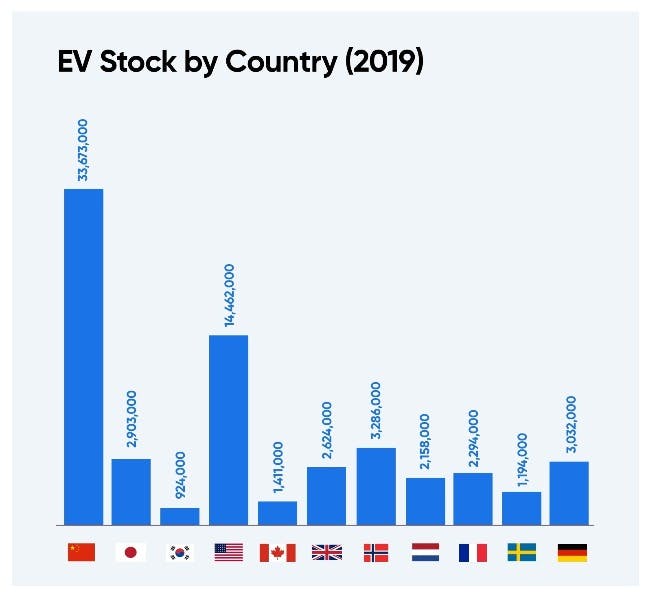
Each year, the number of pure electric and plug-in hybrid electric vehicles on the roads rises across the globe.
Unsurprisingly, with the largest global population, China has the highest overall EV stock (33,673,000), followed by USA (14,462,000) and Norway (3,286,000).
Of the countries examined, South Korea has the lowest stock (924,000).
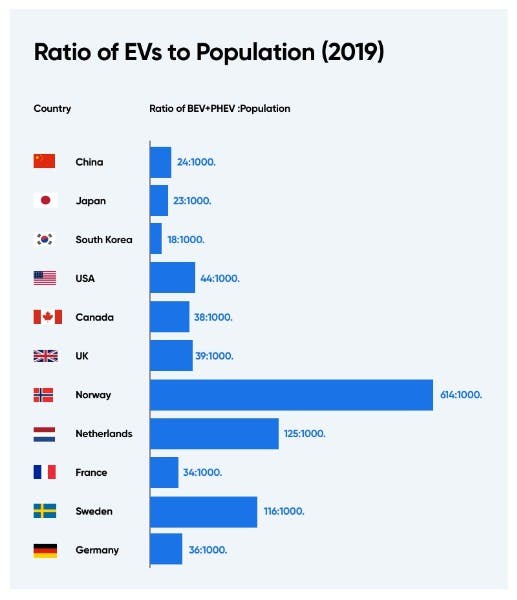
This figure alone, however, does not tell us how widespread adoption is. As shown above, for every 1000 people, Norway has the highest ratio of EVs (614:1000), followed by the Netherlands (124:1000) and Sweden (116:1000).
Market Share
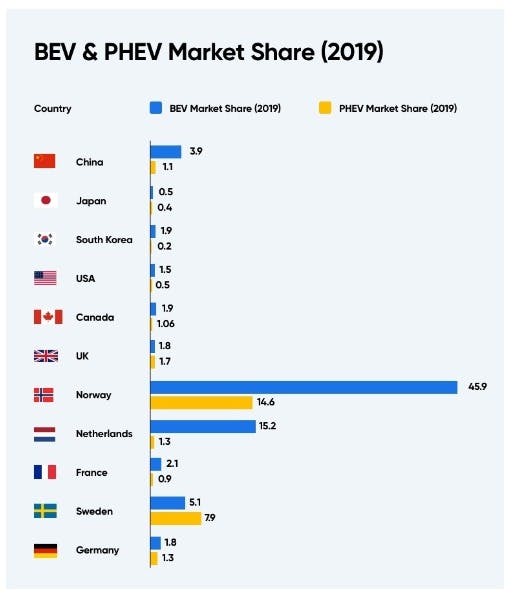
Whilst electric cars are growing in popularity, globally they hold a small share of the wider automotive market.
In Norway, electric vehicles hold a solid share of the automotive market (45.9%). The Netherlands follows with a more modest 15.2%, then Sweden with 5.1%.
WIth the exception of Sweden, every country has a higher BEV market share than PHEV.
Japan has the lowest BEV market share of 0.5% - this is unusual given that the globally popular Nissan Leaf EV is the product of a Japanese automotive manufacturer.
The USA has the second lowest share at 1.5% (similarly unusual for the homeland of all-electric Tesla), followed by the UK and Germany at 1.8%.
Chargers
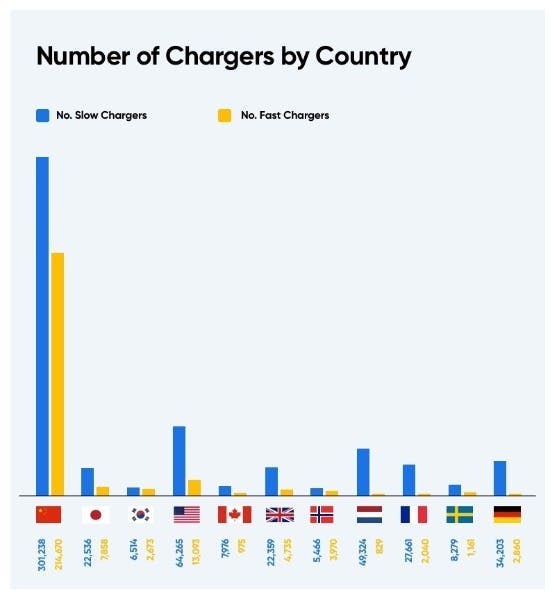
Range anxiety is one of the largest obstacles for prospective EV drivers so a strong public charging network is a must to facilitate wider adoption.
The table above shows that China has significantly more chargers, both fast and slow, than other countries on this list (301,238 slow and 214,670 fast). This makes sense given the country's size. America comes in second with 64,265 slow and 13,093 fast chargers, whilst South Korea has the lowest number (6,514 slow and 2,673 fast).
These figures must be understood in relation to the number of electric cars on the road.
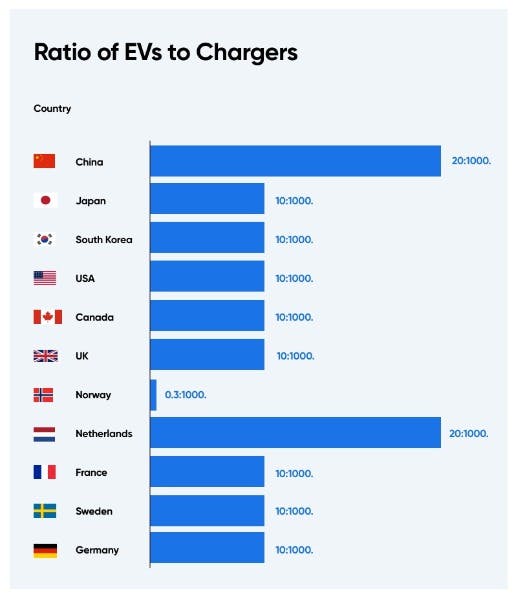
Eco-conscious motorists in Norway have very little competition when it's time to juice up their vehicles - they have an incredibly low ratio of 0.3 EVs for every 1000 chargers.
Most other countries on the list have 10 EVs for every 1000 chargers, with the exception of China and Netherlands with the highest ratio of 20 EVs per 1000 chargers.
Whilst in China this high ratio may have played a partial role in the lower ratio of EVs:Population, it has not hindered the Dutch who have the second highest BEV market share.
EV Ownership Costs
Whilst the charging network is crucial to support widespread adoption of EVs, upfront and running costs also factor into a consumers’ decision to make the shift.
| Cost of EV* (in £s) | Cost of EV as % of Median Salary | Cost of Charging (For an hour, in £s) | EV Incentives | Purchase Subsidy (in £s) | |
|---|---|---|---|---|---|
| China | £28,531.82 | 614.50% | 3.04 | Y | £1,719.40-£2,391.21 |
| Japan | £36,664.25 | 144.29% | 11.02 | Y | Based on driving range |
| South Korea | £37,258.78 | 121.37% | 4.18 | Y | £4,933.93 |
| USA | £24,009.14 | 73.32% | 5.70 | Y | £1,121.35-£44,853.90 |
| Canada | £30,723.72 | 99.06% | 4.18 | Y | £1,868.91-£3,737.83 |
| UK | £40,490.00 | 170.46% | 9.88 | Y | £3,000.00 |
| Norway | £33,360.36 | 86.24% | 3.80 | Y | - |
| Netherlands | £43,611.21 | 150.44% | 7.22 | Y | £3,560.60 |
| France | £44,510.51 | 190.42% | 7.98 | Y | £6,231.06 |
| Sweden | £49,847.44 | 131.35% | 6.84 | Y | £5,263.00 |
| Germany | £38,218.21 | 152.61% | 14.44 | Y | £6,676.13-£8,011.36 |
Cost of Electric Car By Country
Tesla struck gold with the Model 3 - it’s the best-selling electric model in the world. The table below outlines how much the vehicle costs around the world in comparison to the median salary.
Its birthplace, the USA, is the cheapest place to buy it, both in terms of the overall price tag and as a percentage of median salary (73.32%). Norway is second cheapest (86.24%) and Canada in third (99.06%).
Buying a Model 3 is the most expensive for Chinese residents - the price tag is the equivalent of just over six years salary (614.5%). France and the UK are second and third most expensive at 190.42% and 170.46% respectively.
The upfront cost of an EV is a clear contributor to China’s low ratio of EVs to population, even when taking into account Government incentives which will be discussed later on.
| Median Salary (£) | Cost in Original Currency | Cost (£) | Cost ($) | Cost (EUR) | Cost of EV as % of Median Salary | |
|---|---|---|---|---|---|---|
| China | £4,643.06 | ¥249,900.00 | £28,531.82 | $37,705.39 | €31,984.38 | 614.50% |
| Japan | £25,410.64 | ¥5,110,000 | £36,664.25 | $48,510.00 | €41,137.51 | 144.29% |
| South Korea | £30,699.07 | ₩54,790,000 | £37,258.78 | $49,182.24 | €41,700.81 | 121.37% |
| USA | £32,745.63 | $31,690.00 | £24,009.14 | $31,690.00 | €26,945.21 | 73.32% |
| Canada | £31,013.87 | $52,990.00 | £30,723.72 | $40,557.50 | €34,482.71 | 99.06% |
| UK | £23,754.01 | £40,490.00 | £40,490.00 | $53,419.47 | €45,301.92 | 170.46% |
| Norway | £38,683.94 | 399,900.00 kr | £33,360.36 | $44,020.03 | €37,273.71 | 86.24% |
| Netherlands | £28,988.35 | €48,980.00 | £43,611.21 | $57,756.73 | €48,980.00 | 150.44% |
| France | £23,374.60 | €49,990.00 | £44,510.51 | $58,841.58 | €49,990.00 | 190.42% |
| Sweden | £37,951.42 | 569,900.00 kr | £49,847.44 | $66,009.52 | €55,957.31 | 131.35% |
| Germany | £25,043.25 | €42,900.00 | £38,218.21 | $50,440.10 | €42,900.00 | 152.61% |
Cost of Charging an Electric Car
Electricity costs are far lower than petrol and diesel - the table below shows how much it costs to “fill up the tank” of an EV around the world.
As a percentage of median salary, China is the most expensive place to charge an EV (0.049%), with Germany and Japan ranking second and third priciest at 0.044% and 0.033% respectively.
Norway offers the cheapest electricity costs (0.007%), followed by South Korea (0.011%), then USA and Sweden (both at 0.013%).
The high upfront and running costs of an EV for Chinese residents is a real stumbling block to increasing the EV stock, and in the absence of any substantial charging government incentives, it is a ripe opportunity for growth.
| Prices (£/kw/hr) | Cost Per 10 Miles | Cost Per 100 Miles | Cost of Full Charge | Full Charge as % of Median Salary | |
|---|---|---|---|---|---|
| China | 0.06 | £0.07 | £0.74 | £2.28 | 0.049 |
| Japan | 0.22 | £0.27 | £2.70 | £8.36 | 0.033 |
| South Korea | 0.09 | £0.11 | £1.10 | £3.42 | 0.011 |
| United States | 0.11 | £0.13 | £1.35 | £4.18 | 0.013 |
| Canada | 0.08 | £0.10 | £0.98 | £3.04 | 0.01 |
| United Kingdom | 0.2 | £0.25 | £2.45 | £7.60 | 0.032 |
| Norway | 0.07 | £0.09 | £0.86 | £2.66 | 0.007 |
| Netherlands | 0.14 | £0.17 | £1.72 | £5.32 | 0.018 |
| France | 0.16 | £0.20 | £1.96 | £6.08 | 0.026 |
| Sweden | 0.13 | £0.16 | £1.59 | £4.94 | 0.013 |
| Germany | 0.29 | £0.36 | £3.55 | £11.02 | 0.044 |
Incentives
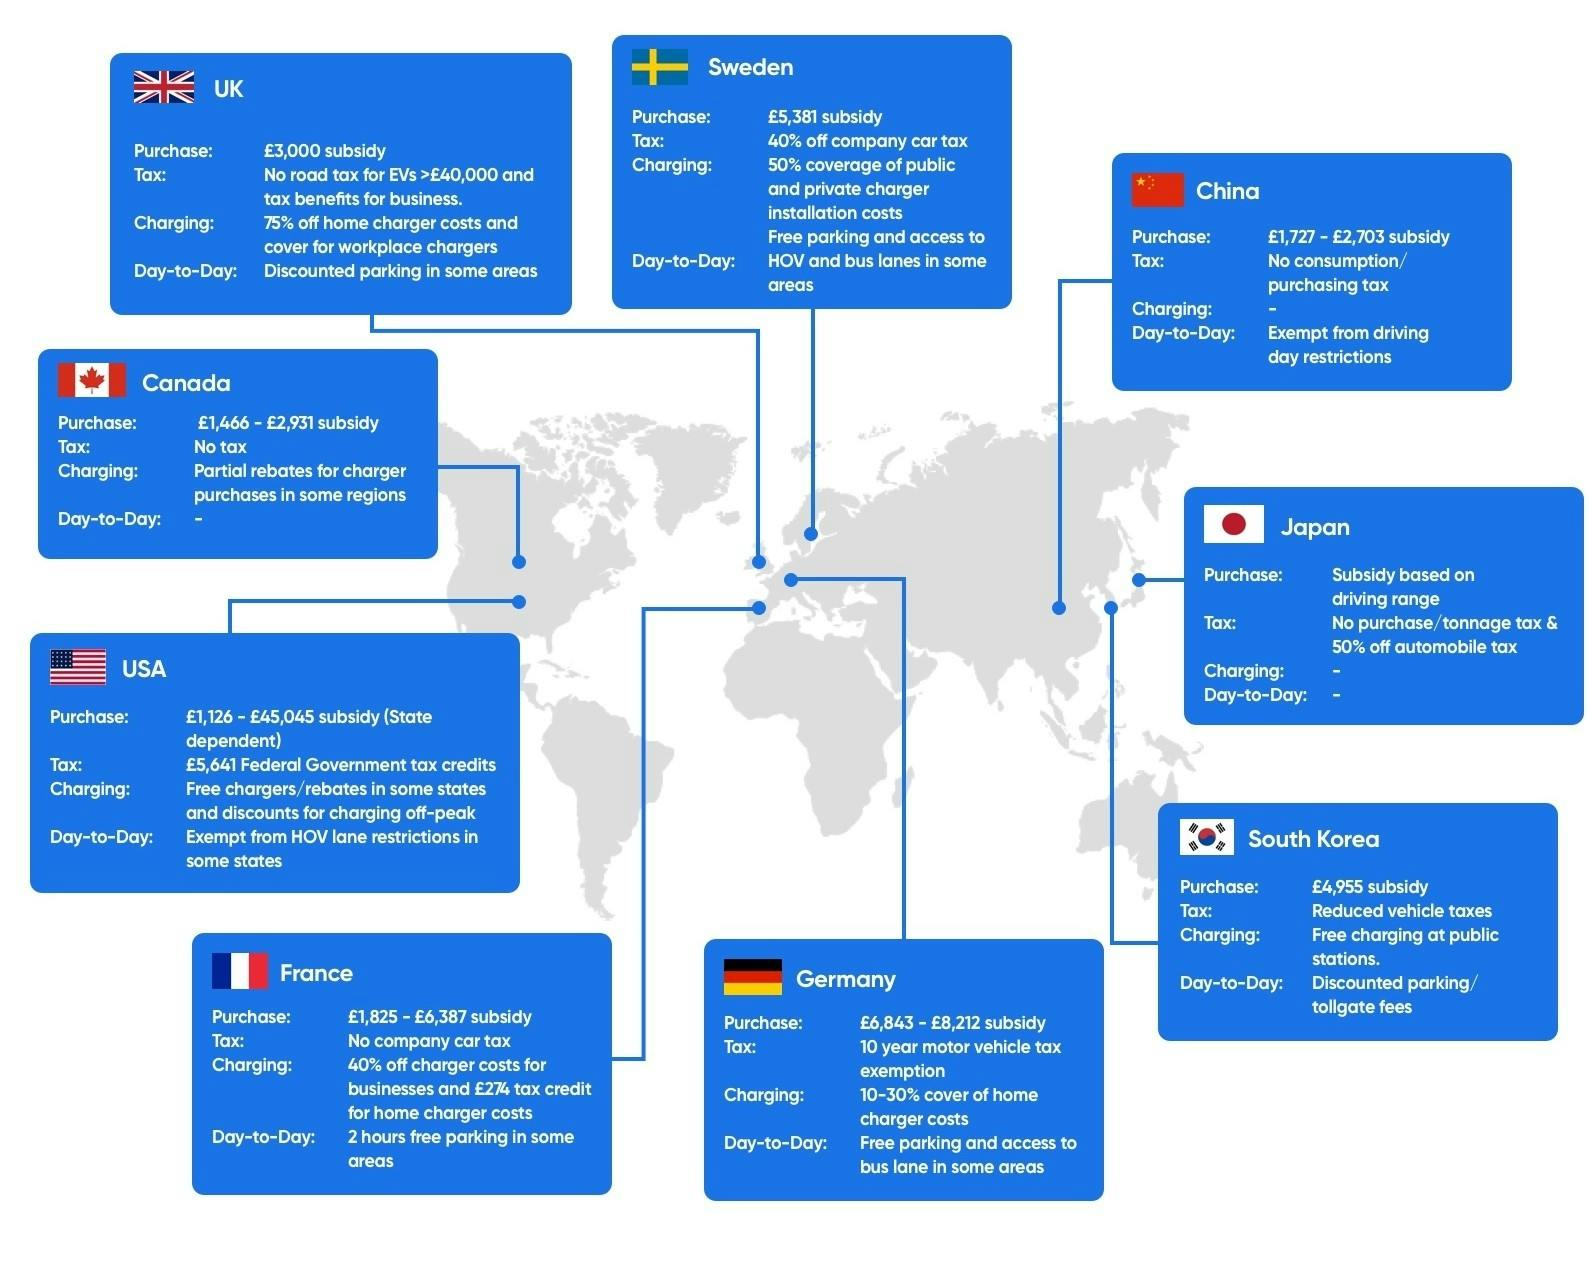
Making the switch to an EV is not a decision that is taken lightly, so government incentives play a big role in EV adoption. Covering things like purchase subsidies, tax exemptions, and grants for chargers, there is a variety on offer from country to country. The most notable incentives from country to country are outlined below.
Norway no longer offers a purchase subsidy now that their adoption figures are so high. All other countries offer a purchase subsidy.
As the most expensive place to purchase an EV in terms of local salary, the Chinese subsidy still appears too low to incentivise people to make the switch. Even with the highest possible subsidy, the cost is still 5.5x the annual median salary. Similarly, China has no substantial charging incentives, either for purchase or to subsidise charging costs. They subsequently have the highest ratio of EVs to chargers and the highest charging costs.
In France, with the government subsidy, the cost of an EV as a percentage of median salary drops around 30% to 163.7%, which is still amongst the highest on the list. With a substantial charging network, low charging costs, and generous incentives to cover charger installation costs and tax exemptions for business, French consumers have more reason to invest.
All other countries have varying incentives, from free chargers to free charging and this is reflected in their 50% lower ratio of EVs to charging stations.
Conclusion
This Index gives a simple overview of the different rates of progress of different countries in the race to electrify the roads. Norway is almost 50% towards the goal, whilst other countries have much more work to do.
Additionally, the Index gives some insight into the reasons why different countries have achieved different rates. It’s clear that some factors affect some countries more than others, but overall, a combination of reasons contribute to the levels of EV adoption.
These reasons include the upfront cost of EVs and charging costs as a percentage of the median salary, the ratio of EVs to chargers, and the incentives offered by the government in relation to subsidised vehicle and charger purchases.
Methodology
Statistics were sourced from a variety of authoritative sources, including Statista. All information collected in December 2019. For the full Excel format data set with individual sources cited, please contact the Lease Fetcher team directly.
